
2. What data can be collected?
With multiple data sources, you will be able to collect very diverse data, both qualitative and quantitative, on your market, your audience, your clients, or your performance.
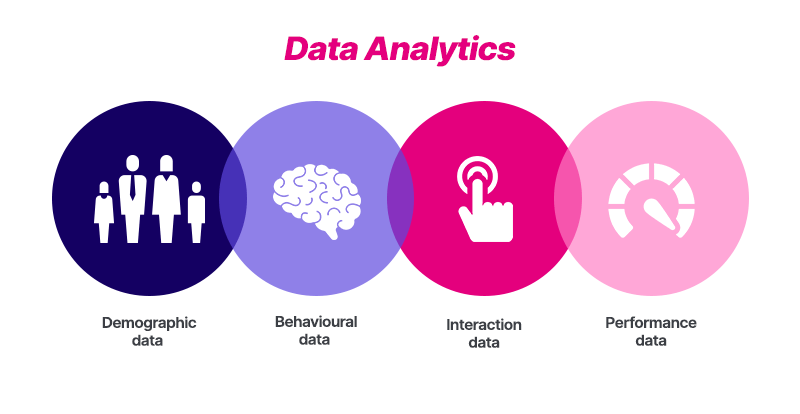
a.Demographic data
Demographic data provides information about individuals’ characteristics, such as age, gender, geographic location, education level, household composition, etc.
This data helps you better understand your target audience, personalize your campaigns, and tailor messages based on users’ or prospects’ specific preferences and needs.
To collect this data, surveys, sign-up forms, and cookies can be used. You can also rely on your CRM database if this client information is available, to create relevant segmentation based on their profile.
b.Behavioral data
Behavioral data tracks users' behavior when interacting with your website, applications, or advertisements.
Thanks to data tracking, you can obtain information about the user journey, such as the pages visited, time spent on each page, actions taken (purchases, downloads, clicks, etc.), entry and exit pages, etc.
Using this data helps identify user behavior trends, optimize user experience, and increase conversion rates.
c. Interaction data
Interaction data includes users’ direct interactions with the company, whether through customer service, comments on social media, satisfaction surveys, or emails.
This includes zero-party data, which represents optional information that the consumer voluntarily provides to a company, as opposed to first-party data, which is directly collected by companies from their audiences, clients, and prospects.
This data is essential to assess customer engagement, improve brand reputation, and identify potential issues to resolve them quickly.
d. Performance data
Performance data measures the results of marketing and advertising campaigns. It provides key information on click-through rates, traffic, click-to-visit drop-off rate, conversions, revenue generated, etc.
These are valuable management tools to guide decision-making and activate the right business and marketing levers to optimize your return on investment (ROI). By analyzing this data, you are able to invest more efficiently in your campaigns and achieve your ROI objectives set in your digital strategy.
Important: In any data collection and storage process, ensure you are compliant with the GDPR or nLPD regulations in force depending on your territory. To stay up to date with the subtleties of these regulations and turn them into your best allies, check out our article.


4. What are the 4 types of data analysis?
When it comes to data analysis, we generally distinguish four levels: descriptive, diagnostic, predictive, and prescriptive analysis. Each of these levels provides different information and insights to help companies make informed decisions and move forward with certainty rather than intuition.
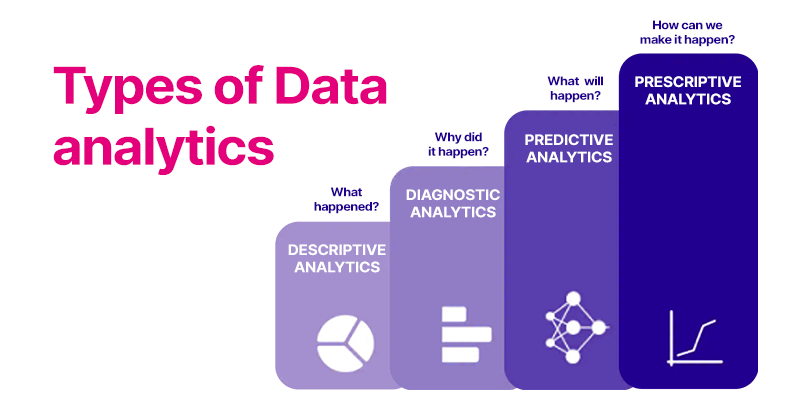
a.Descriptive analysis
Descriptive analysis is the most basic level of data analysis. It involves describing and summarizing data factually, clearly, and concisely. Its main goal is to give an overview of past events and current trends:
- Basic statistics: averages, medians, modes, standard deviations, etc.
- Charts and tables: visual representations of data, such as histograms, bar charts, pie charts, etc.
- Segmentations: dividing data into homogeneous groups to better understand their characteristics.
b. Diagnostic analysis
Diagnostic analysis aims to understand why certain events occurred by identifying the factors or causes that influenced them. It builds on descriptive analysis results to deepen data understanding:
- Correlation analysis: identifying relationships between different variables to understand how they interact.
- Regression analysis: assessing the relationship between a dependent variable and one or more independent variables to explain data variations.
- Causality analysis: determining the factors that led to a specific event.
c.Predictive analysis
Predictive analysis involves using statistical models and algorithms to anticipate customer behaviors and market trends based on past and current data. This allows businesses to make proactive decisions, optimize campaigns, and effectively target potential customers:
- Predictive modeling: using mathematical models to forecast future outcomes, such as sales predictions, market trends, etc.
- Time series analysis: forecasting future values based on historical trends over time.
- Clustering analysis: grouping similar data to identify patterns and emerging trends.
d. Prescriptive analysis
Prescriptive analysis goes beyond prediction by offering solutions and recommendations to achieve specific objectives. It helps companies choose the best course of action based on previous analysis results:
- Optimization: identifying the best combination of variables to achieve a set goal, e.g., optimizing ad spend to maximize conversions.
- Scenarios and simulations: evaluating possible outcomes based on different strategies to make informed decisions.
- Expert systems: using rules and algorithms to provide real-time recommendations.
With the recent rise of artificial intelligence, predictive and prescriptive analyses are increasingly effective and represent a real asset for companies that rely on them.
By combining these four types of data analysis, companies can get the most out of their data.
Here are a few examples of data-driven decisions guided by different types of analysis:
- For a marketing campaign: descriptive analysis might show that Wednesday emails perform better. You would then adjust your scheduling accordingly.
- For conversion rates: diagnostic analysis may reveal that cart abandonment mainly occurs on mobile. A targeted UX redesign could be initiated to fix this issue and improve the indicator.
- For sales forecasting: predictive analysis will help anticipate demand and better manage inventory.
- For pricing optimization: prescriptive models will identify the right price based on season, demand, and customer profile.